Tackling Malaria
Cluster Analysis
As might be expected the cluster analysis shows that many of the compounds are singletons with no similar analogues in the data-set, the histogram below shows the distribution of cluster sizes using the Maccs fingerprints, around 8,500 compounds are singletons. The results using MCS and 3PP clustering show a similar profile but of course the members of the clusters are very different.
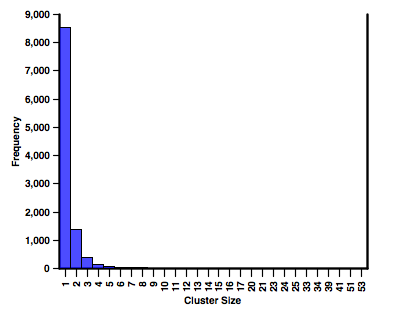 Many compounds are singletons but there are a number of fairly significant clusters
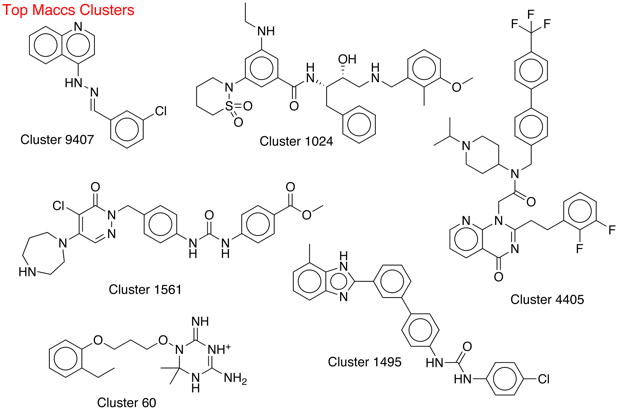
| Maccs Clusters |
| Cluster Number | Cluster Size |
| 9407 | 53 |
| 1024 | 51 |
| 4405 | 41 |
| 1561 | 39 |
| 60 | 34 |
| 1495 | 33 |
| 4107 | 25 |
| 8641 | 24 |
| 4083 | 23 |
| 2801 | 21 |
| 991 | 20 |
| 1127 | 20 |
| 4882 | 17 |
| 5681 | 17 |
| 9426 | 16 |
| 750 | 15 |
| 944 | 15 |
| 1123 | 15 |
| 1183 | 15 |
| 1395 | 15 |
| 2967 | 15 |
| 6660 | 14 |
| 1212 | 13 |
| 2065 | 13 |
| 5672 | 13 |
| 1131 | 12 |
| 2218 | 12 |
| 2390 | 12 |
| 5798 | 12 |
| 7257 | 12 |
| 7476 | 12 |
| 9448 | 12 |
| 8139 | 11 |
| 930 | 10 |
| 951 | 10 |
| 1093 | 10 |
| 1130 | 10 |
| 3190 | 10 |
| 4097 | 10 |
| 8112 | 10 |
| 8253 | 10 |
| |
|
 |
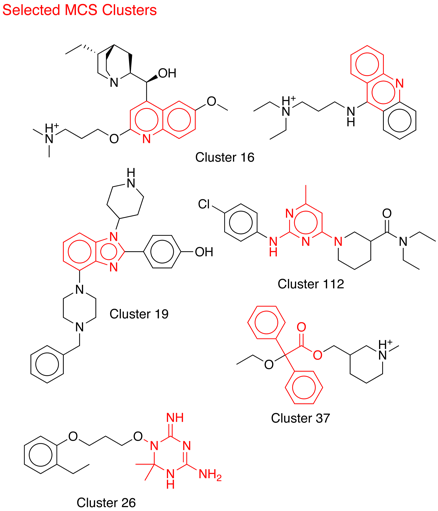
| MCS Clusters |
| Cluster Number | Cluster Size |
| 16 | 1,874.00 |
| 12 | 1,435.00 |
| 34 | 1,041.00 |
| 105 | 652 |
| 19 | 631 |
| 10 | 595 |
| 9 | 576 |
| 97 | 518 |
| 67 | 435 |
| 36 | 411 |
| 35 | 327 |
| 89 | 317 |
| 2 | 304 |
| 7 | 284 |
| 112 | 258 |
| 51 | 256 |
| 109 | 249 |
| 103 | 215 |
| 107 | 214 |
| 39 | 206 |
| 114 | 178 |
| 37 | 153 |
| 91 | 106 |
| 8 | 103 |
| 106 | 103 |
| 26 | 98 |
| 111 | 94 |
| 104 | 84 |
| 14 | 83 |
| 110 | 73 |
| 1 | 72 |
| 11 | 69 |
| 29 | 67 |
| 53 | 66 |
| 144 | 64 |
| 32 | 62 |
| 123 | 62 |
| 65 | 61 |
| 119 | 60 |
| 50 | 56 |
|
 |
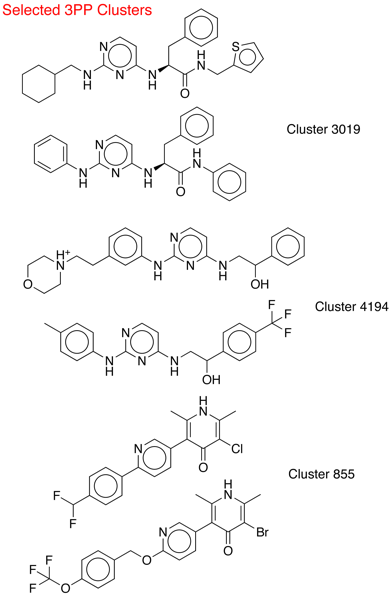
| 3PP Clusters |
| Cluster Number | Cluster Size |
| 3019 | 64
|
| 1028 | 58 |
| 187 | 45 |
| 3600 | 44 |
| 4834 | 41 |
| 4194 | 40 |
| 433 | 34 |
| 2846 | 34 |
| 1277 | 33 |
| 1851 | 32 |
| 7370 | 32 |
| 4907 | 30 |
| 509 | 28 |
| 2586 | 28 |
| 6456 | 27 |
| 855 | 26 |
| 3021 | 26 |
| 6709 | 26 |
| 57 | 25 |
| 7583 | 25 |
| 4859 | 24 |
| 6532 | 24 |
| 1171 | 23 |
| 1565 | 23 |
| 1934 | 23 |
| 1937 | 23 |
| 6666 | 23 |
| 7398 | 23 |
| 949 | 22 |
| 6272 | 22 |
| 3539 | 21 |
| 3672 | 21 |
| 1015 | 20 |
|
_ |
First Page
Cluster Analysis
Using the Filemaker Pro Database